Playing it differently: the mavericks of Season 28
By David Marsden · Hamburger SV
Most Top 100 managers set their teams up in much the same way. So who did something different this season, and did it work? The AI has crunched the numbers from all 1,900 league match reports from Season 28. Each report shows both teams’ starting tactics and starting XIs.
What decides a match: ratings and home advantage
Before the mavericks, the two things every manager has to play with: the quality of their XI, and where the game is played.
Ratings matter most. The gap in average rating between the two starting XIs is the best single predictor of a result:
| Home XI compared with away XI | Home win | Draw | Away win | Home points per game |
|---|---|---|---|---|
| 4+ points weaker | 4% | 12% | 84% | 0.24 |
| 3 points weaker | 18% | 13% | 68% | 0.68 |
| 2 points weaker | 25% | 28% | 47% | 1.03 |
| 1 point weaker | 38% | 22% | 40% | 1.36 |
| Level | 40% | 23% | 37% | 1.44 |
| 1 point stronger | 46% | 22% | 32% | 1.59 |
| 2 points stronger | 53% | 22% | 25% | 1.82 |
| 3 points stronger | 55% | 19% | 26% | 1.84 |
| 4+ points stronger | 88% | 12% | 0% | 2.77 |
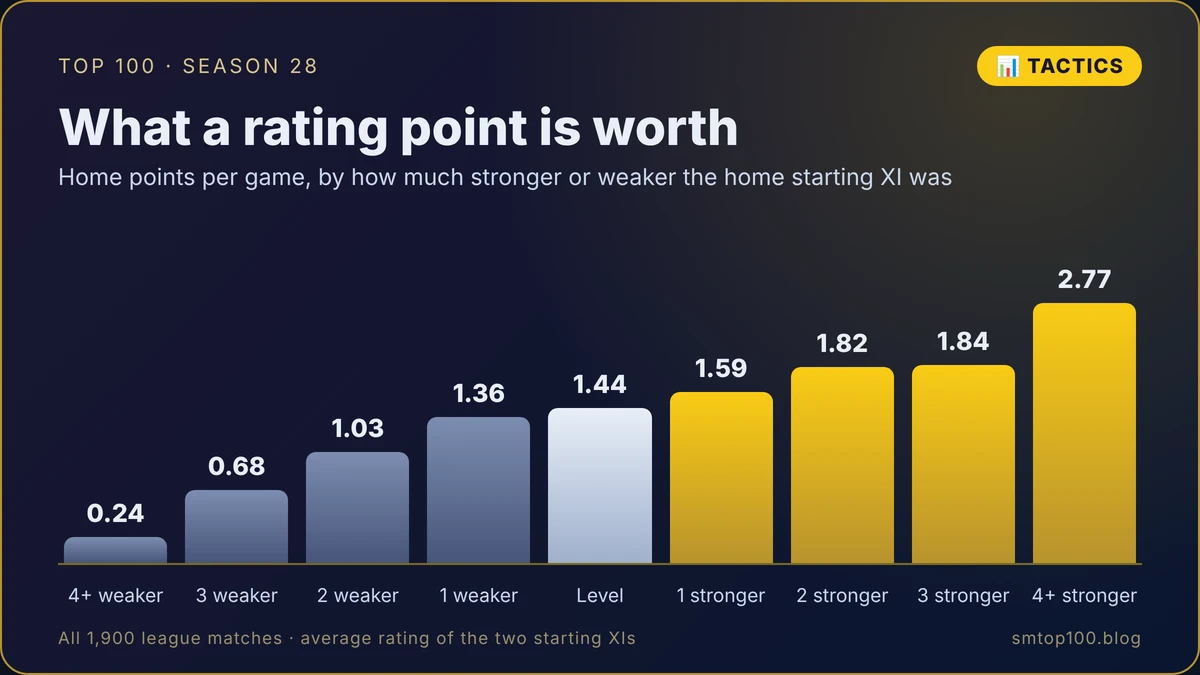
On average, every point of average rating is worth about a sixth of a point a game. Once the gap reaches four points, the stronger side almost always wins: not one home side with an XI four or more points stronger lost all season.
Home advantage is real, but smaller. Home sides took 1.45 points a game (41% wins) against 1.33 away (37%). With level XIs, home sides won 40% and away sides 37%. Playing at home is worth a bit less than one point of average rating, roughly two extra points over a season’s home games.
A fair test
Because ratings matter so much, judging a manager by points alone isn’t fair. So for every team in every match, the AI worked out the points a team with that rating gap, home or away, would expect. Then it measured how far each club finished above or below that, in points per game. +0.10 is about four points over a season.
The mavericks who made it work
| Club | Finished | Above expected | What was different |
|---|---|---|---|
| SSC Napoli | D4 champions | +0.50 | Neither attacking nor defensive, and direct passing |
| SL Benfica | D2 champions | +0.43 | A defensive mentality |
| Udinese Calcio | D2 runners-up | +0.35 | Defensive, sitting deep |
| RCD Espanyol | D1 12th | +0.31 | Defensive and slow, with weaker XIs than their opponents |
| SS Lazio | D5 4th | +0.21 | 4-4-2 |
| Girondins Bordeaux | D5 9th | +0.16 | Seven different formations, with weaker XIs than their opponents |
Napoli won Division 4 doing half a point a game better than their line-ups predicted, without ever committing to attack or defence.
Benfica won Division 2 with a defensive set-up, more than two-fifths of a point a game better than their line-ups predicted. Udinese went up behind them, also defensive and sitting deep.
Espanyol stayed up in Division 1, usually fielding the weaker XI. Glen Mullan’s young side took almost a third of a point a game more than expected: “We stayed up against the odds.”
Bordeaux are the exception to the rule below: seven formations, and still above expected.
The clubs who beat their line-ups by the most played it straight. PSV (+0.87) and AZ Alkmaar (+0.72) won Division 5 and finished runners-up, and Olympique Lyonnais (+0.63) finished 4th in Division 4. Atalanta (+0.52) completed Division 5’s automatic promotion, and FC Porto (+0.45) won Division 1.
The mavericks who didn’t
| Club | Finished | Above expected | What was different |
|---|---|---|---|
| Juventus | D1 20th | −1.03 | Neither attacking nor defensive |
| Feyenoord | D4 20th | −0.93 | 4-2-3-1 A, neither attacking nor defensive |
| Fenerbahçe SK | D5 19th | −0.49 | 4-3-3 |
| Internazionale | D2 15th | −0.44 | Defensive and deep, with XIs over a point stronger |
| Club Brugge KV | D5 15th | −0.44 | 3-4-3, with XIs a point stronger |
| ACF Fiorentina | D5 14th | −0.33 | 4-1-3-2, defensive and deep, with stronger XIs |
| FC Schalke 04 | D5 13th | −0.25 | Very defensive, pressing in their own area, long balls |
| Borussia Dortmund | D1 6th | −0.09 | 4-3-3, with XIs nearly two points stronger |
Juventus and Feyenoord were the two biggest underperformers in Top 100, around a full point a game below what their line-ups predicted. Juventus took 13 points; their line-ups predicted 52.
Inter and Fiorentina show that going defensive can backfire. Both usually fielded the stronger XI, sat deep and finished well below expectations.
Brugge’s 3-4-3 produced some of the highest-scoring games in Top 100, nearly four goals a game, but turned XIs a point stronger than their opponents’ into a 15th-place finish.
Dortmund finished a respectable 6th in Dario Saviano’s final season. With XIs nearly two points stronger than their opponents’, though, the line-ups predicted a little more.
Trying too hard to beat the system
Hamburger SV are a cautionary tale, and I can say that because they’re my club.
I changed formation and tactics from game to game, depending on the opponent’s strength and whether we were home or away: attacking at home, a back five or a back three away at stronger sides. Over the season, Hamburger used nine different set-ups, and the most common one in only a quarter of games. We took 32 points from 38 games, against 43 that our line-ups predicted.
It wasn’t just me. Across Top 100:
- The 39 clubs that stuck with one set-up in at least nine games out of ten finished +0.16 a game above expected.
- The 61 clubs that switched more often finished −0.10 below it.
- When those switchers did change their set-up, they did worse than expected in every situation: against stronger XIs (−0.22), against level XIs (−0.26) and against weaker ones (−0.27). In their usual set-up they were right where their line-ups predicted.
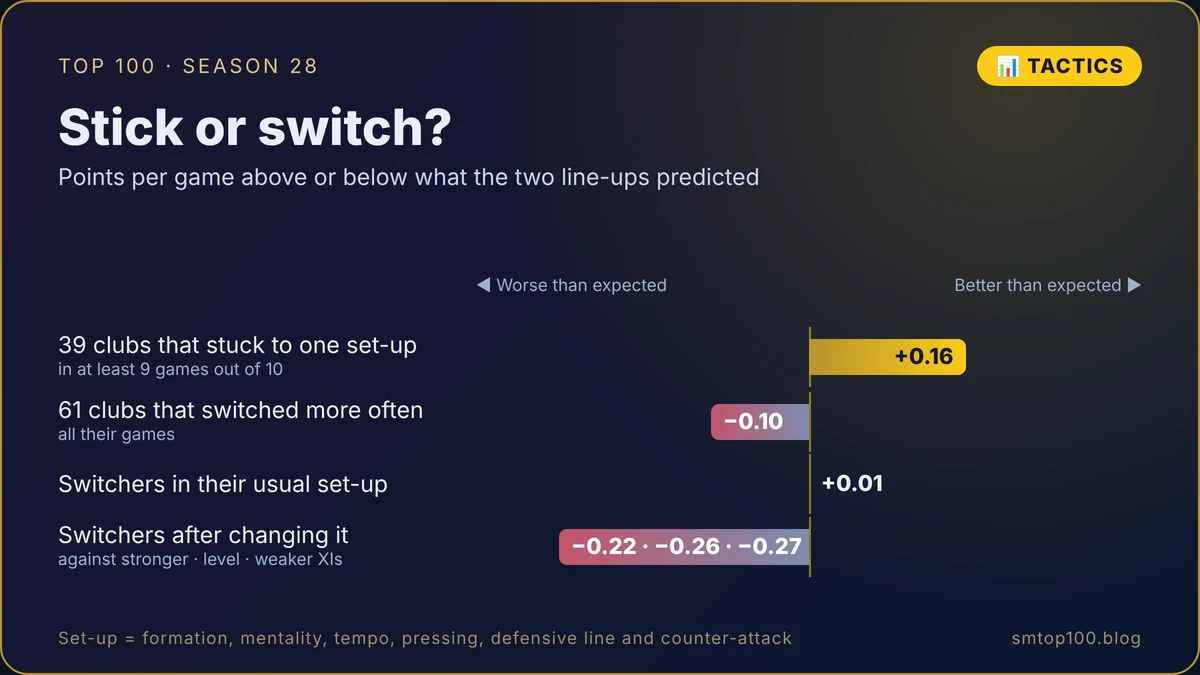
Struggling teams may switch because they’re struggling, so this doesn’t prove switching costs points. But the managers who picked a plan and stuck to it did best, and the ones trying to out-think every opponent, me included, did worst.
One more thing: morale
Thanks to Mister TRX for the heads-up on this one.
Player morale has only been recorded since late September, so this covers about 300 matches from the second half of the season. With two XIs of the same strength, the side whose players had much higher morale (four points or more on average) won 50% and took 1.74 points a game. The side with much lower morale won 26% and took 1.02. Weaker XIs with much higher morale did better than stronger XIs with much lower morale.
Morale goes up when you win, though, so it may be a sign of a club doing well rather than the reason. Season 29 will be the first full season with morale recorded from day one.
Health warning
This shows what went with good results, not what caused them. These are starting tactics, and many managers change things during a match. The records cover every league game of the season.
Who’ll be Season 29’s maverick?